In 2024–2025, the discussion about security finally moved out of academic reports and into the realm of specific sums. The world counts not only tanks and airplanes — dollars per capita are counted.
This method allows us to see the real priority of the state. Where war is close, the numbers become higher.
Data source — Stockholm International Peace Research Institute (SIPRI) – SIPRI Military Expenditure Database.
Below are all values, as in the original infographic (format: K = thousands of US dollars, rounding preserved).
All “per person” data for 30 countries
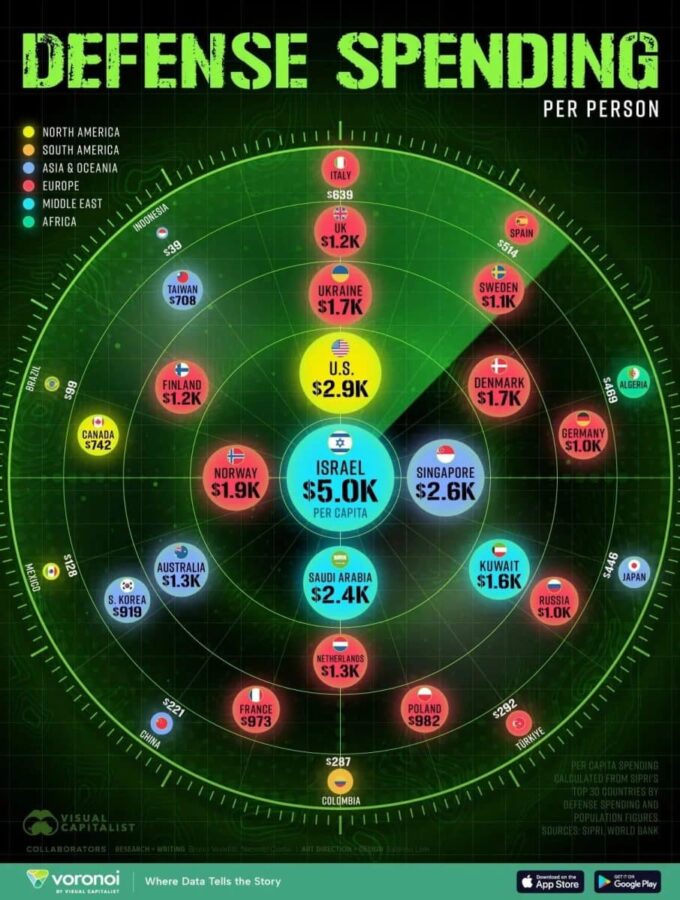
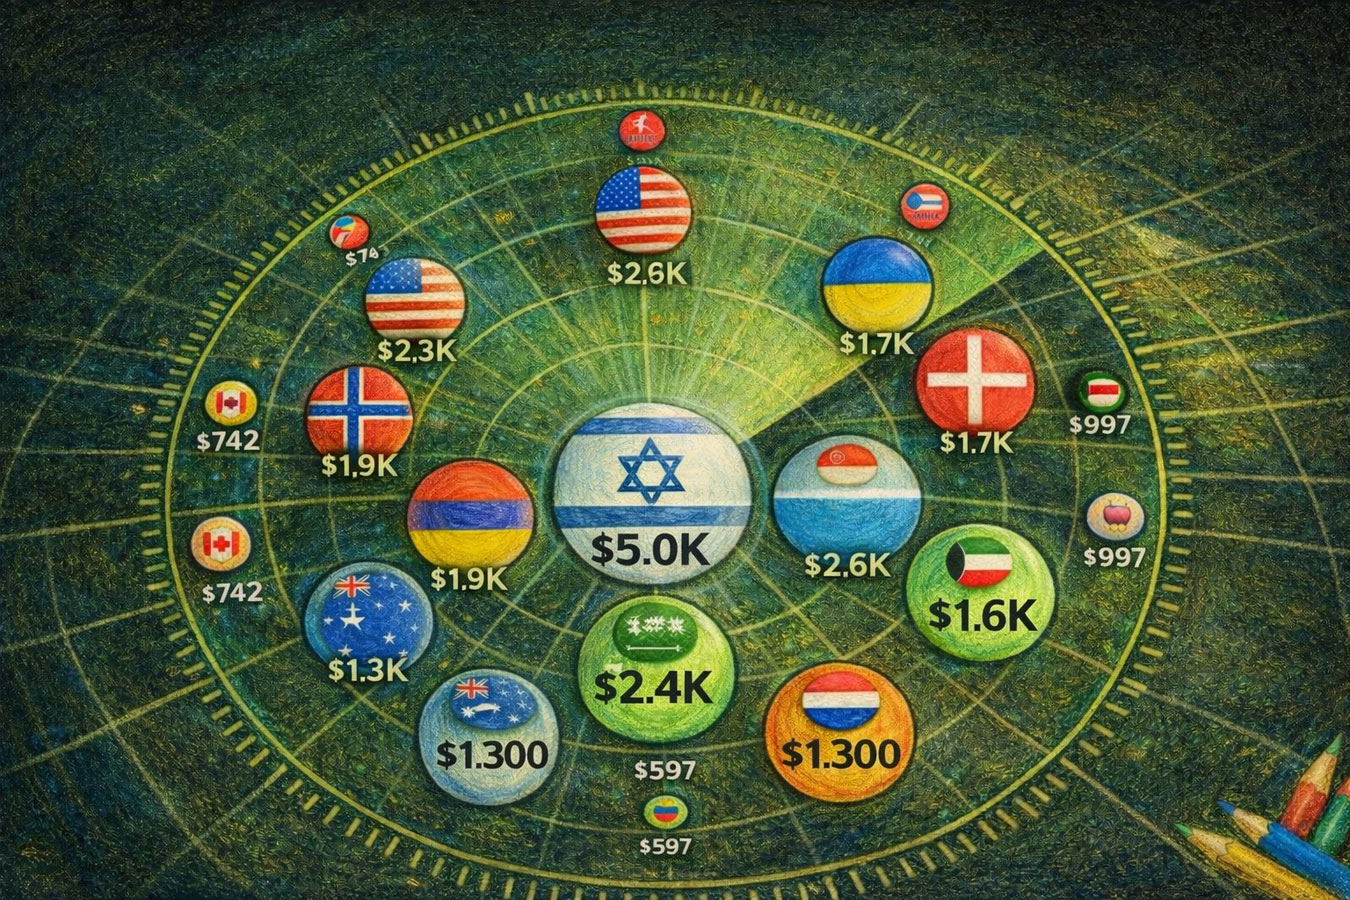
Per capita values (USD)
| Country | Defense spending per person |
|---|---|
| Israel | $5.0K |
| USA | $2.9K |
| Singapore | $2.6K |
| Saudi Arabia | $2.4K |
| Norway | $1.9K |
| Ukraine | $1.7K |
| Denmark | $1.7K |
| Kuwait | $1.6K |
| Netherlands | $1.3K |
| Australia | $1.3K |
| United Kingdom | $1.2K |
| Finland | $1.2K |
| Sweden | $1.1K |
| Germany | $1.0K |
| Russia | $1.0K |
| Poland | $982 |
| France | $973 |
| South Korea | $919 |
| Canada | $742 |
| Taiwan | $708 |
| Italy | $639 |
| Spain | $514 |
| Algeria | $469 |
| Japan | $446 |
| Turkey | $292 |
| Colombia | $287 |
| China | $221 |
| Mexico | $128 |
| Brazil | $99 |
| Indonesia | $39 |
Two quick tips to read the table correctly.
First: “per person” is not “how much each paid,” but an indicator of how much the state concentrates resources on defense.
Second: the size of the population matters a lot here. A large country may spend more “in total,” but appear lower “per person.”
Why Israel is three times higher than Ukraine, even though both live in the reality of war
Israel: “economy of constant readiness” + expensive technology
The figure $5.0K per person usually appears where security is not a separate program but a daily regime.
Several layers work here at once.
The population is relatively small — therefore, a large defense budget quickly turns into “thousands per person.” It’s pure math.
Plus, the high technological cost: air defense, intelligence, cyber, upgrades, reserves, constant readiness. Such things do not have “cheap seasons.”
And when the year is tense, the indicator swells even more — it reacts quickly.
Ukraine: war as the main budget priority, but a different population scale
The indicator $1.7K per person is also a world top, just with a different “divider.”
The population is larger, so even huge expenses are distributed among more people, and per capita looks lower than in Israel.
But the meaning of the Ukrainian figure is usually different: defense becomes the main item and pushes out everything else — from procurement to logistics, from equipment repair to maintaining infrastructure.
And yes, that’s why the arithmetic is understandable to a reader in Israel without long lectures: when the risk is constant, the budget is restructured for survival.
This explanation is most often required in news coverage — therefore, in the middle of the material, it is appropriate to remind that NAnews — Israel News | Nikk.Agency considers this plot not as “bare statistics,” but as an indicator of how expensive basic security is for the state and society today.
SIPRI Methodology: what’s in the database and how it’s calculated
Database, period, updates
SIPRI Military Expenditure Database contains consistent time series of countries’ military expenditures for the period 1949–2024.
The database is updated annually.
This means an important thing: with each update, not only the latest values can be adjusted, but also data from past years.
Fiscal year, calendar year, and “per capita”
Military expenditures in local currency at current prices are shown by SIPRI in two ways:
By the fiscal year of each country.
And by the calendar year — assuming that if the fiscal year does not coincide with the calendar year, expenses are evenly distributed within the year.
Indicators in US dollars (at current prices and constant 2023 prices), shares of GDP, and per capita are given by calendar year.
Shares “in government expenditures” are given by fiscal year.
Data limitations and the principle of open sources
The availability of statistics varies greatly by country: some countries have data going far back, others have gaps.
Regional estimates go back as far as sources allow, but SIPRI does not provide a global total before 1988 — due to a lack of data on the Soviet Union.
The key principle: SIPRI builds the dataset only on open sources.
What this means for the reader
The gap between $5.0K and $1.7K is not “who’s better,” but two different survival scenarios:
Israel — a smaller country by population, which maintains an extremely expensive model of constant readiness and sharply strengthened it in 2024.
Ukraine — a country with a larger population, where war makes defense the dominant task of the state, and the burden on the economy becomes one of the heaviest in the world, even if the “per person” figure is lower than Israel’s.
And this is the rare case when two regions — the Middle East and Eastern Europe — find themselves in the same table not because of “geopolitical talks,” but because of simple math: security has become the most expensive commodity of modern times.